
PRICE ACTION TRADING
What is Price Action?
Price action is a technique that is used by traders to make trading decisions of any stocks for a short period of time to make a PROFIT. Adding to that, price action is not only limited to stocks, it extends to other assets like Commodity, Currency, and CryptoCurrency assets. Price action trading is not just about trading price without making use of any indicators! Good traders also make use of a limited number of required indicators and live data to make better decisions to select better securities to trade at that particular time.
What is Technical Analysis?
Technical Analysis is the derivative of price action where people make a trading decision from the data insight of the past price of an asset class like stock. Trading decisions are made when an asset breaks its previous highs, lows, and consolidation phase. The consolidation phase is where the small-small chart patterns and price action patterns are formed which will eventually give fresh breakouts.
Ok, That we know the definition of price action and technical analysis. You all have these questions, Why Price Action, What does price action tell you?, Why should I use it? And what are the price action trading tools available. Let us understand more about price action by looking at Wyckoff’s Theory.
What is Wykoff’s Theory?
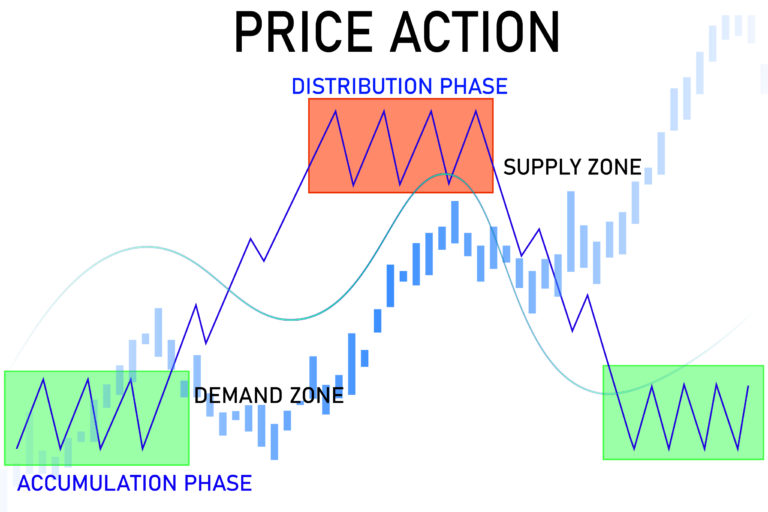
Wyckoff’s theory is a price action theory developed by Richard Wyckoff. He observed that the market is not moving in any random direction, rather it is making some type of patterns again and again over the period of time no matter which time frame you look into it. Wyckoff’s theory stated the price of any asset moves in four different phases! Accumulation, Markup, Distribution, and Mark-down. Look at the picture below, where you can see the accumulation and distribution phase of price action.
Now let us understand what happens in the Accumulation and Distribution phase, or simply it is a consolidation phase where both we don’t have a clear winner between buyers and sellers.
What is the accumulation phase?
In this phase where buyers and sellers had equal strength for a period of time, but eventually buyers turned into winners which caused the asset to give a strong breakout in that particular asset or a security. Breakout was just the first step! What actually causes the mark-up phase? Which is a trending phase and that is the phase many people, like me, and you want to trade to make big money.
What happens when it gives a strong breakout? The seller’s stop loss was hit! When the seller’s stop loss was hit they actually become buyers which gives assets more strength because of the new buyers. Also, when there is a fresh breakout new people enter into that security for buying that asset who were patiently waiting for a breakout which intern gives more strength to the breakout security, so we see mark-up phase. If you didn’t get it by now let me keep it simple the cause of the mar-up phase was Breakout, Sellers Stop Loss[Became Buyers], and New Buyers.
What is the Distribution Phase?
In this phase also where buyers and sellers had equal strength for a period of time, but eventually sellers turned into winners which caused the asset to give a strong breakout in the downside of that particular asset or a security. Similar to accumulation, let’s understand the psychology which causes the mark-down phase.
When an asset gives a breakout in the downside, that phase is called the distribution phase. Here buyers exit from that security when a breakout happened the stop loss of buyers was hit which gave more strength to the asset for the mark-down phase also the breakout attracted new sellers into that asset, so we see a nice mark-down phase. Let’s keep things simple the cause for the mark-down phase was Breakout, Buyers Stop Loss[Became Sellers], and new Sellers into the system.
What is the mark-up phase?
In the mark-up phase, the security keeps making higher-highs and higher-low’s. Higher-highs are the point when the security breaks its previous high of itself, that point is called higher-high. Similarly, the security makes higher-low just above the previous swing low point, which is referred to as higher-low.
What is the mark-down phase?
In the mark-down phase, the security keeps making lower-lows and lower-highs. Lower-low’s are the point when the security breaks its previous low of itself, that point is called lower-low. Similarly, the security makes lower-high just below the previous swing high point, which is referred to as lower-high.
Can you trade in this mark-up and mark-down phase? Yes, you can trade when the security breaks the previous higher-high, keep the previous higher-low as stop loss. Similarly, for the mark-down phase, you take a trade when the security breaks the previous low. Literally, we should work on the accumulation and distribution phase the mark-up and mark-down phase should be our result for our work. Remember, as a retail trader you should always prefer to trade consolidation and distribution phase breakout because the risk to reward ratio will favor us.
Guys one more thing when people refer to chart patterns like Double Top, Cup and Handle, Triangle, Wedge, and Head and Shoulder. All these are consolidation patterns that are formed in the consolidation phase. Where they get consolidated and get ready to break out and go into the mark-up or mark-down phase.
Note: Avoid chasing moving trains and catching falling knives, this is in reference to swing trade. But in intraday trading, especially when you are trading any index like [NIFTY50, BANKNIFTY], observing the price action in a small-time frame becomes so important. Where you can trade based on price action (accumulation, distribution, mark-up, mark-down phase) by observing higher-highs, higher-lows, lower-lows, and lower-highs.
Now that you have a fair idea on price action and the psychology behind every phase. Remember, understanding the buyers and sellers psychology in any phase or any particular candle is significant. Every candle of security tells the strength of its own what is happening and what is the probability of the next up-move or down-move. You just need to learn how to read candles and understand the psychology of trading.
Let’s understand a few terminologies which help you to get a better hold of Wyckoff Theory which is referred to as PRICE ACTION which helps to make trading decisions better. Always keeping things simple make your journey fruitful and profitable. The more complex you make your trading decision, the faster you get kicked out of the stock market. Please check the below picture which tell more details about phases of price action.

Supply: Supply is the quantity of asset that a seller is willing to offer for sale at a particular price during that period of time.
Demand: When the buyer is willing to pay any price for that security at that particular period of time is referred to as demand.
Resistance: The price level where it gets many rejections, where there will be more supply than the demand for that particular asset. Which turns the asset to move down to get more demand for it’s supply. If the demand is less and supply is more, Then the asset will break all the support and the price keeps moving down.
Support: The price level where the demand will fulfill the supply of that security. Which makes the asset move up to get more supply for its demand. If the supply is less and demand is more, then the asset will break all the resistance and the price keeps moving up.
Consolidation: In this particular phase where none of the buyers and sellers haven’t yet come up as winners. We as retail should observe this phase and take a trade when there is a clear breakout on either side according to your strategy and risk appetite.
Re-Accumulation: This is a consolidation phase where buyers come out as winners against the sellers. In any quality stock, this phase is very common. People accumulate the stock when the stock is discounted or trading in a range for a small period of time.
Re-Distribution: This is also a consolidation phase where sellers come out as winners against winners. Here, usually big people or institutions sell stocks to retailers and get out of that security if they decide that stock is not good for them.
Note: Security, Stock, and Asset are all the same things.
Note: Even though if the stock is fundamentally good, some stocks perform bad due to government strict rules and regulation. I always feel picking the right stock is very hard in India due to naughty leader and not so well organized stock market. But there are few quality stocks in Indian stock which one can invest in.
Note: Psychology and mindset is a very important factor in the stock market. So I will come up with a good number of blogs on mindset in the stock market. So have patience and learn one thing at a time.
Let me answer a few questions that I mentioned at the beginning of the story. Why Price Action? Price action works in all the time frame. What does price action tell you? Price action tell me critical support and resistance level which intern make my trading decision simple. Why should I use it? It works all the time! What are the price action trading tools available? Trading tools are software which tells the current price of any security and the tools which give live insights of data what is exactly happening in any stock.